Let’s start with Bitcoin:
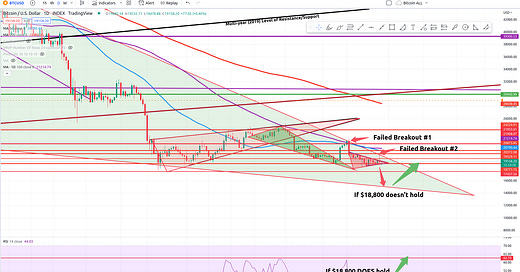
After failing twice to break to the topside of our long-standing bullish descending wedge (since November 2021), #BTC has retraced back down to our super strong support at $18,800. Should this break, look for us to retest our previous low and/or the bottom of our triangle which currently sits at around 15k. We could see prices anywhere from 14k-16k tested with a break of that 18.8k support. Watch this closely.
On the positive side, look at that RSI. Looks to be forming a bullish inverse H&S. Should that pattern follow, look for another test (and possible final break) of the upside of our descending wedge. This would be very bullish for ole’ BTC.
Onto the dollar:
You can see here we are testing that long-standing ascending trend-line (currently working as resistance) since 2009. I did NOT (and still don’t) expect us to break right through. In fact, the 4 hour is showing a bearish ascending wedge (below):
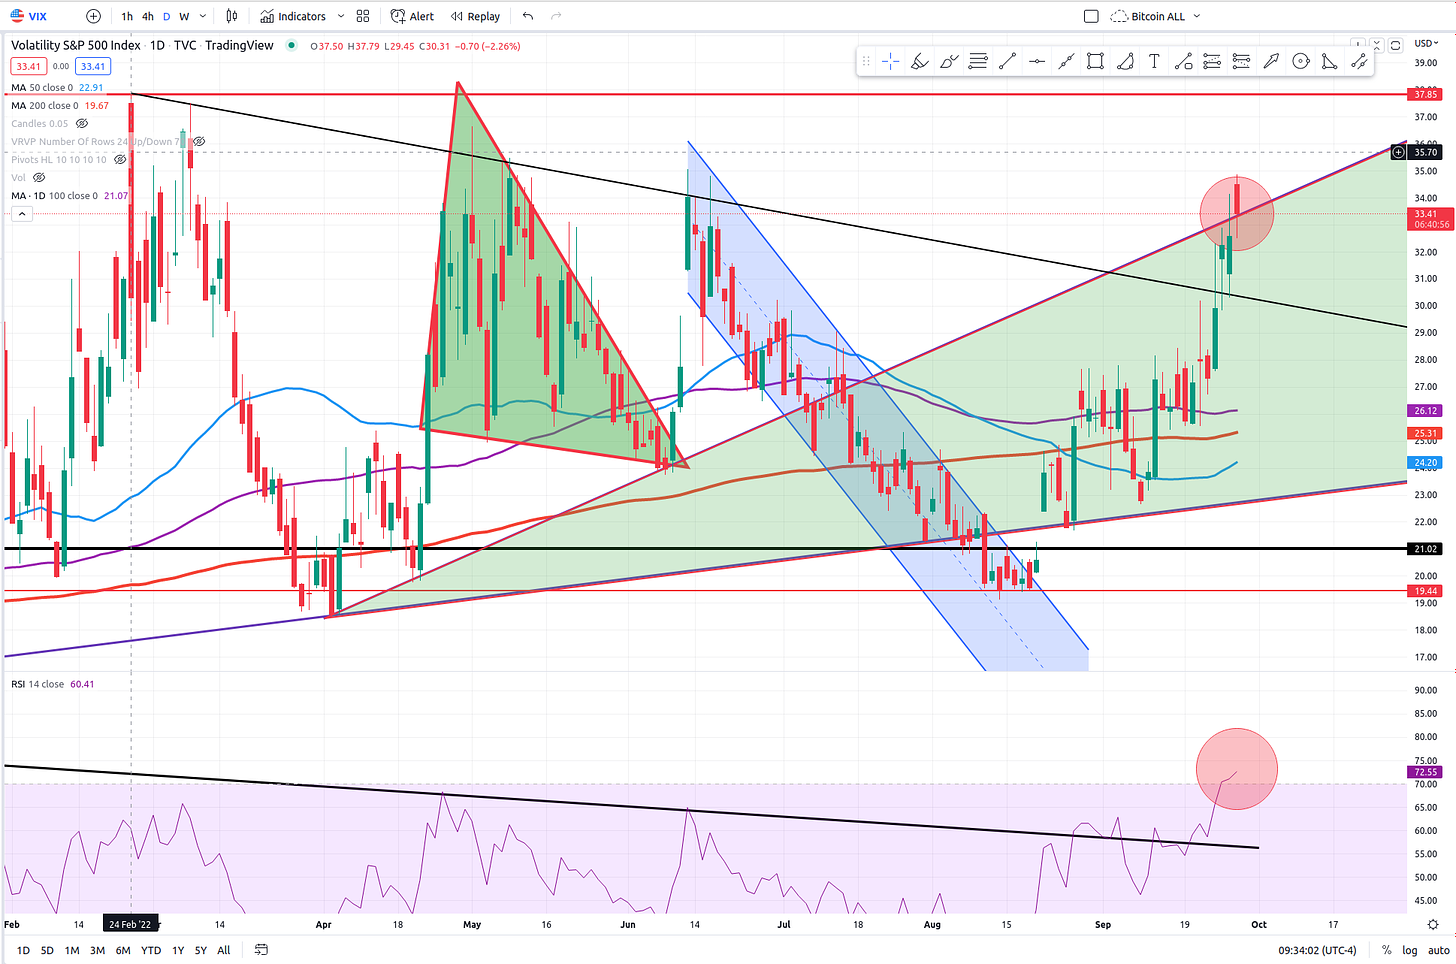
Moving on. You should also have that VIX in your scope:
Could this be a blow-off top?
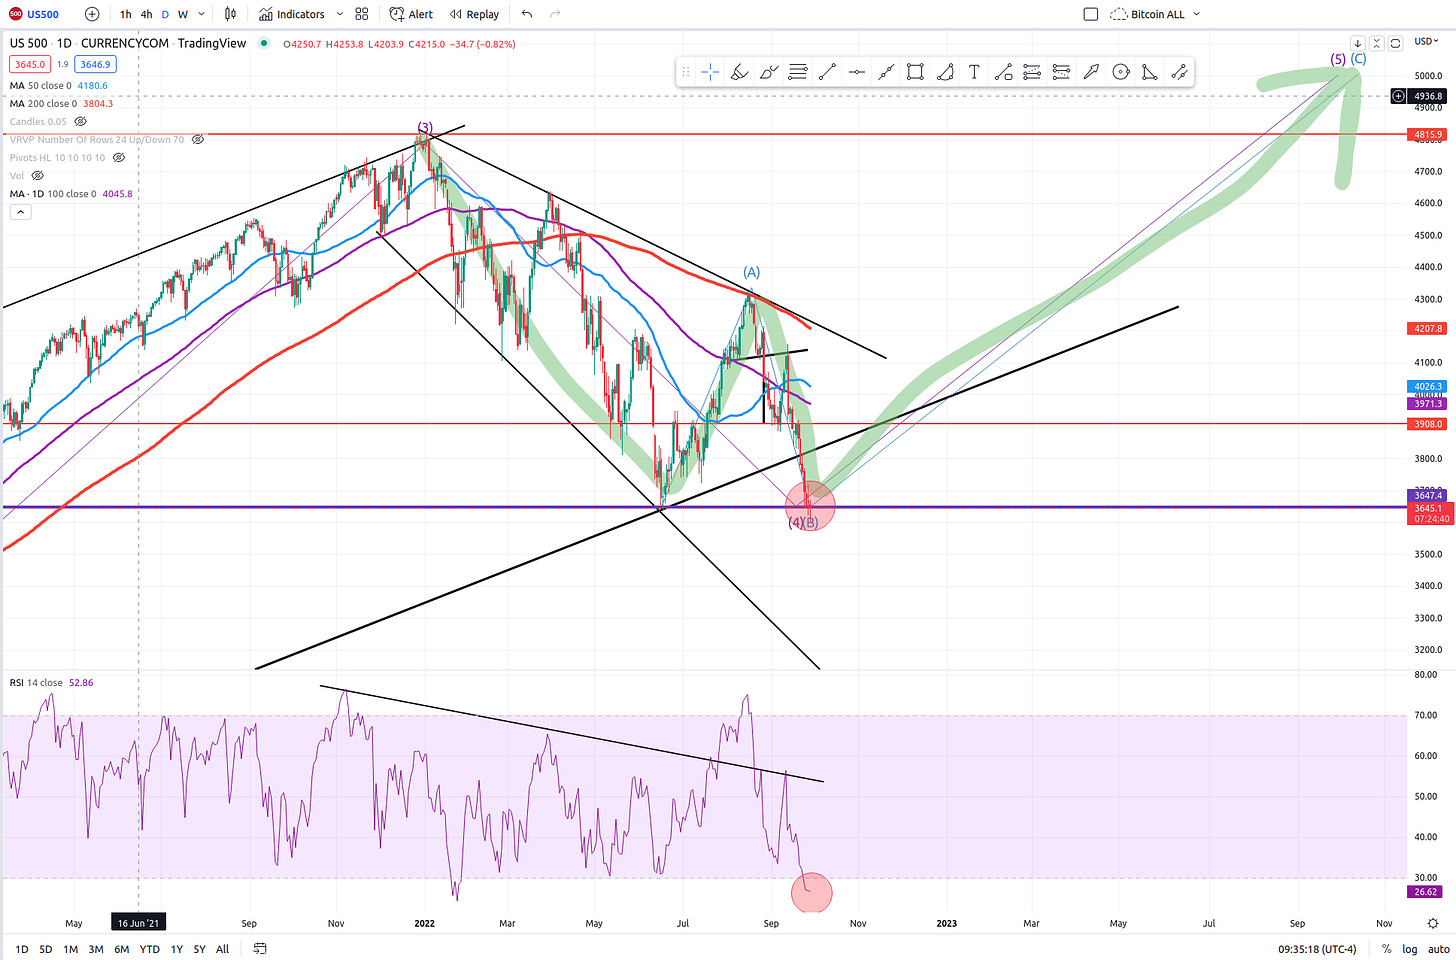
Finally, the US500:
Sitting on very strong support. Still has not broken it to the downside. If it does, look out below! If it doesn’t? Possible “W” or Double-Bottom pattern in formation.


